 |
 |

Note: The purpose of this lesson is two-fold—write a story based on a graph and also make a graph based on a story.
Historical Background on USS Constitution  USS Constitution is the oldest commissioned warship afloat in the world. Carrying a crew of 450 men and over 50 guns, she was launched in 1797 to protect America's freedom on the seas. She was undefeated against the British in the War of 1812 and earned the nickname "Old Ironsides" when a sailor saw a cannon ball bounce off her thick, wooden hull during battle. When she was declared unseaworthy in 1828, she was saved by the American people who rallied for her preservation. After a long career, including capturing a slave ship, circumventing the globe, and serving as a military prison, she is now berthed in Boston and is open to the public. For more information, go to www.allhandsondeck.org, www.ussconstitutionmuseum.org, and www.ussconstitution.navy.mil. USS Constitution is the oldest commissioned warship afloat in the world. Carrying a crew of 450 men and over 50 guns, she was launched in 1797 to protect America's freedom on the seas. She was undefeated against the British in the War of 1812 and earned the nickname "Old Ironsides" when a sailor saw a cannon ball bounce off her thick, wooden hull during battle. When she was declared unseaworthy in 1828, she was saved by the American people who rallied for her preservation. After a long career, including capturing a slave ship, circumventing the globe, and serving as a military prison, she is now berthed in Boston and is open to the public. For more information, go to www.allhandsondeck.org, www.ussconstitutionmuseum.org, and www.ussconstitution.navy.mil. |
||||
| Objectives After completing this lesson, students will be able to: |
|||||||||||||||
|
| Massachusetts Math Curriculum Frameworks | ||||||||||||||||||
|
| Procedure | |||||||||||||||
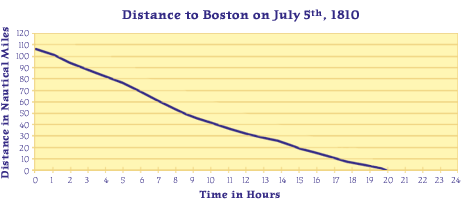
| Begin with worksheet A entitled "Distance to Boston on July 5th, 1810" (see figure 1). During this particular day, Constitution was heading back to Boston Harbor. The graph begins at 12am (time equals 0) and spans the 24 hours of the day. This graph is less complex and meant to introduce the students to some key concepts such as increasing, decreasing, initial value, and constant value, as well as assess the students' ability to interpolate data from a graph.
Start with a general discussion of the graph. Ask questions such as:
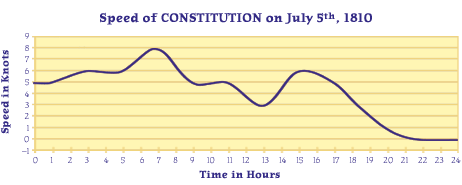
The discussion should involve some specifics, but try to keep it as general as possible. Ask the students to fill in the table on the worksheet by estimating the distances from the graph. Our goal is to start to be more specific about the graph, to start to use numbers to describe as much as possible. From the table, ask the student to write a five-sentence analysis of the trip. Ask the students to use the numbers from the table to describe the behavior. Next, move to worksheet B "Speed of Constitution on July 5th, 1810" (see figure 2). This graph provides more for discussion as it has many more peaks and valleys. The data from the distance graph matches the data from the speed graph, so there can be discussions linking the two together, but be sure to point out the difference between speed and distance as measurements and the reasons between the distinct differences in appearance. Give the students time to fill in the table on the worksheet and then encourage them to write a detailed story about this trip. Again, they may want to include information from the distance graph, but the main intent is for them to be specific and use vocabulary such as increasing and decreasing. Encourage them to use intervals in their explanation, such as the speed is decreasing from 8 knots to 5 knots from 7am to 9am. Also encourage them to give reasons for the change in speed such as less wind or possibly changing the number of sails used. It may lead into good discussions of the ship, crew, and the sailing ship. If the sudents are of high caliber, include a discussion of changing units with the fact 1.35 nautical miles is approximately 1 mile or 1 nautical mile is approximately 6,076.1 feet. Also 1 mile equals 5,280 feet.
At this point, the students should have a good grasp of the graphs and their interpretations. Use worksheet C for the July 7th travel day and ask the students to draw a graph to represent the distance and speed. This may take some time to draw correctly so you may want to work on the distance graph together. Also, the students should label the graph wherever there is interesting behavior. Finally, the students are ready to write their own story and make a graph to represent this story. This can be done as homework. Use worksheet D. The included theme is the traveling speed to Constitution from your original destination, but it easily can be changed. Work with students to write their stories so that they include starting time, top speed, traffic lights, driving through the city at a slower speed, etc. After they have their stories, ask them to make a labeled graph. |
 |

